


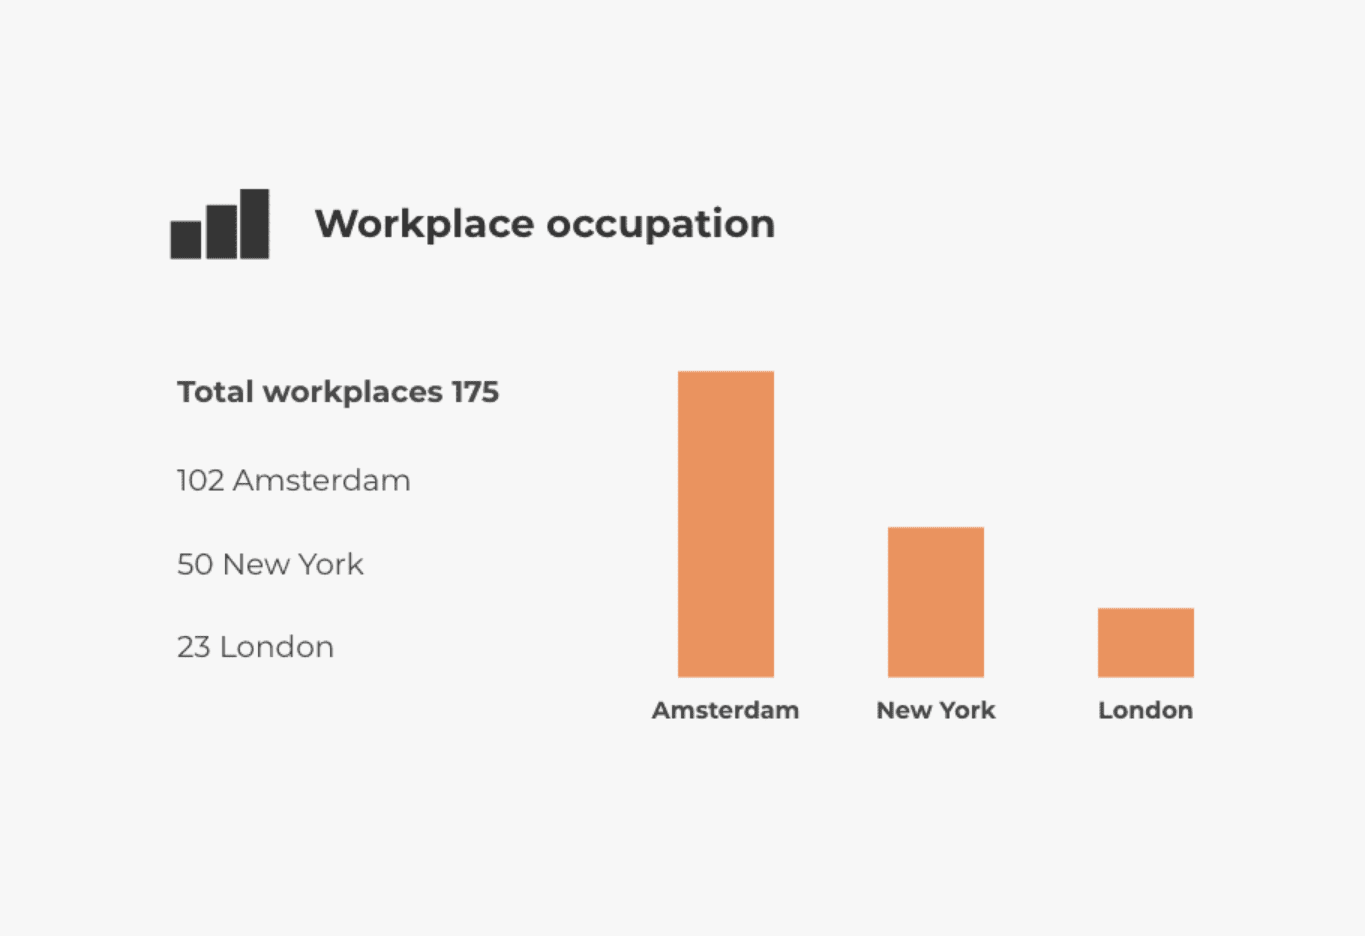
 Analyse office occupancy
Monitor and analyse office statistics
Put your data to good use. Accurate and optimised to help you achieve your best office environment.


Use data to manage and improve your office

Know how employees use your office
Discover the preferences and work patterns of employees so you can facilitate their needs.
Knowing what spaces and services make employees come to the office helps facility managers optimise spaces for a more connected environment.

Save on unnecessary costs
Let data guide your decision-making. Make strategic choices that lead to more efficient resource allocation and substantial savings.
Tip: Close your office on certain days of the week based on low occupancy levels, saving overhead costs over time.

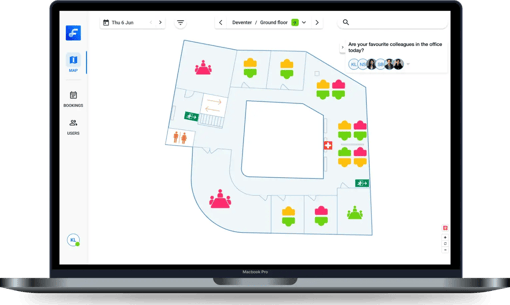
Real-time occupation overview
Actively see how employees are using the office space in real-time, so that you can see if spaces and resources are being used optimally.
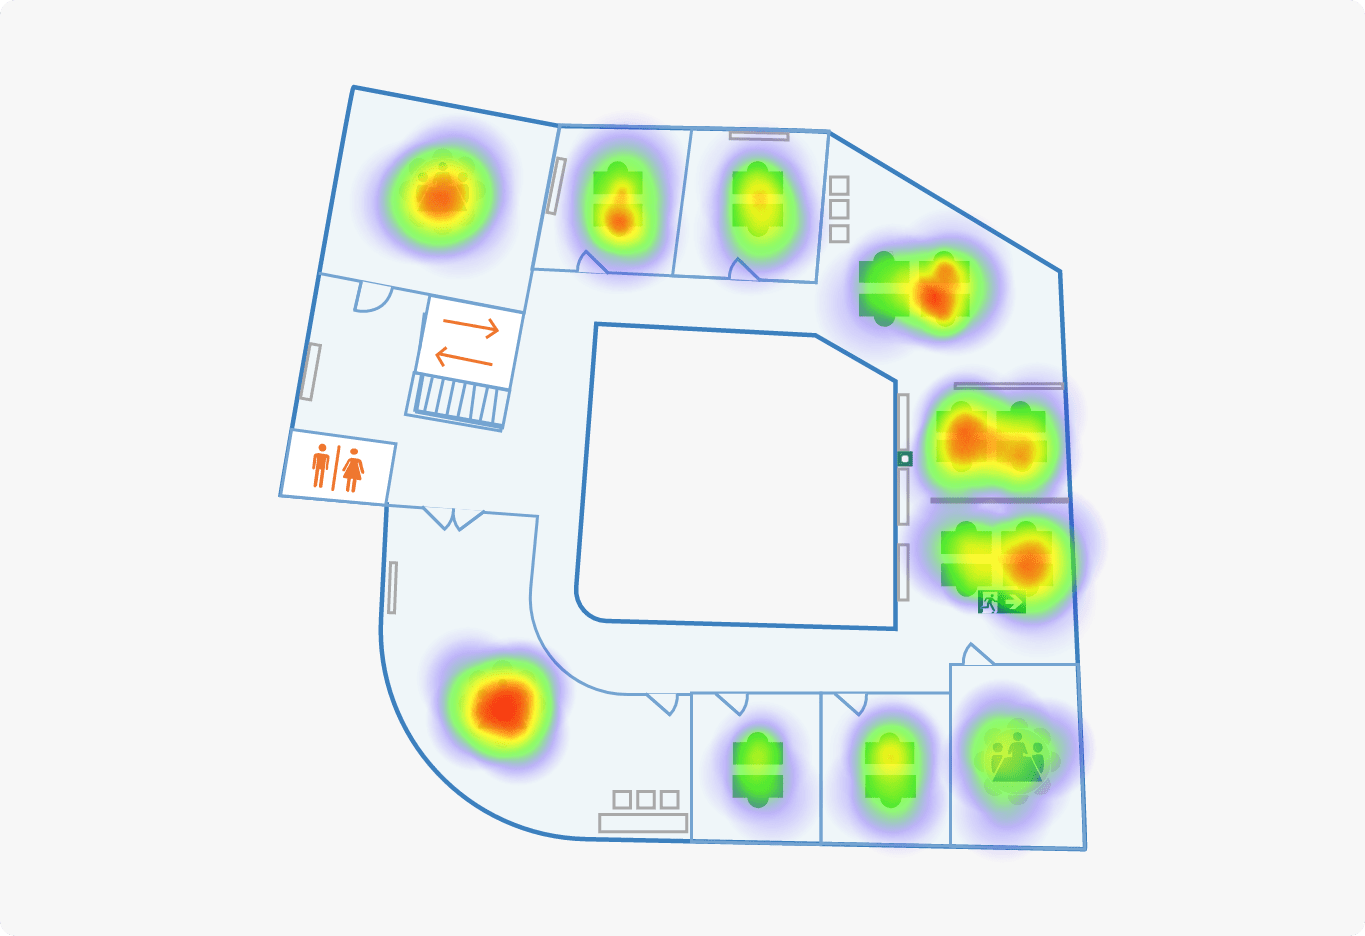
Heatmap
Easily discover office hotspots or under-utilised spaces.
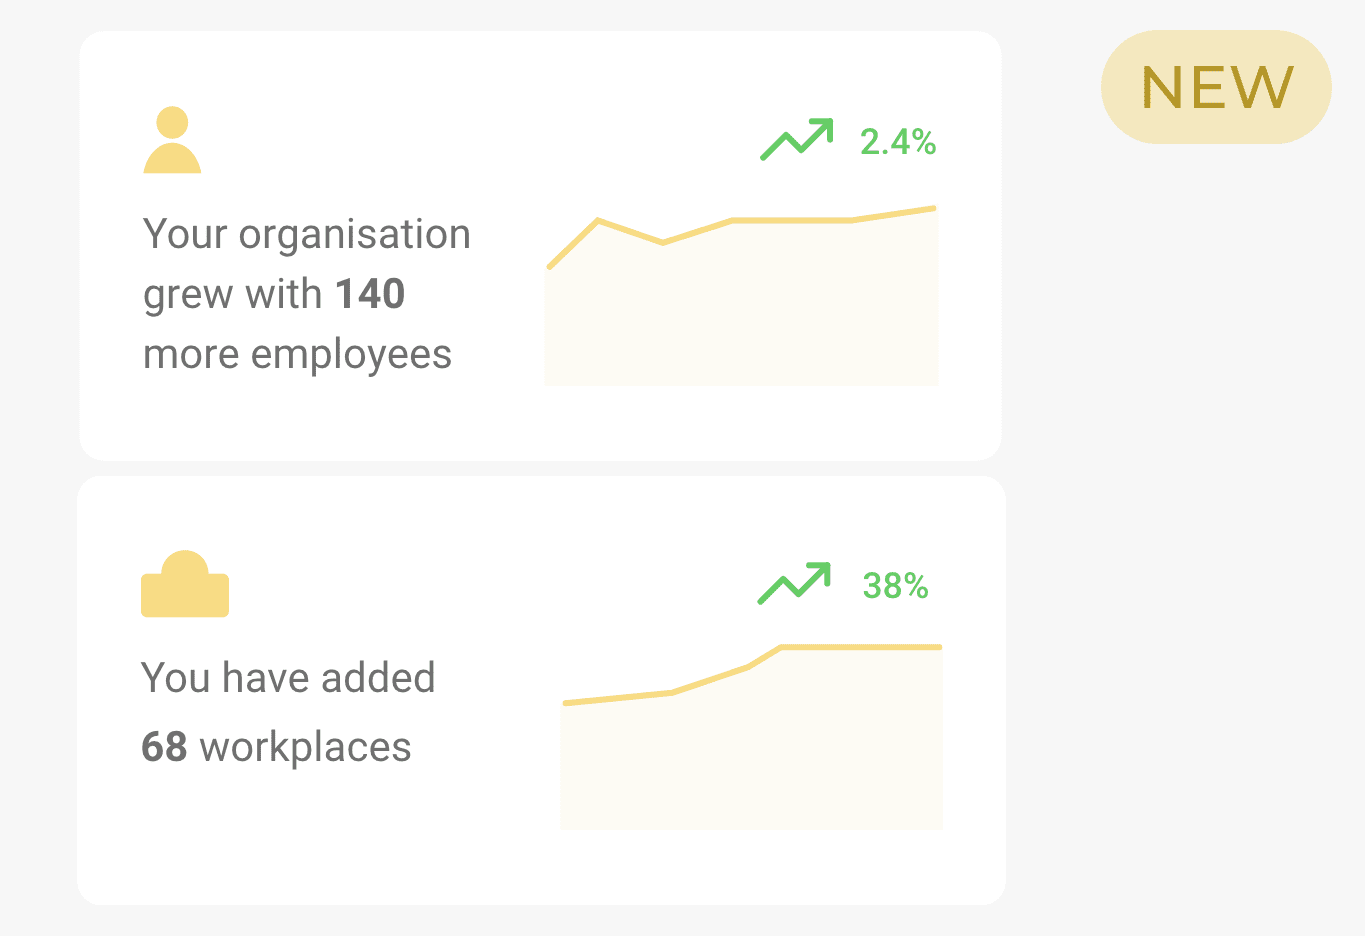
Employee and Workplace Changes
Gain insight into the impact of fluctuating employees and workspaces on your occupancy rate.
Employee and Workplace Changes
Gain insight into the impact of fluctuating employees and workspaces on your occupancy rate.
Heatmap
Easily discover office hotspots or under-utilised spaces.
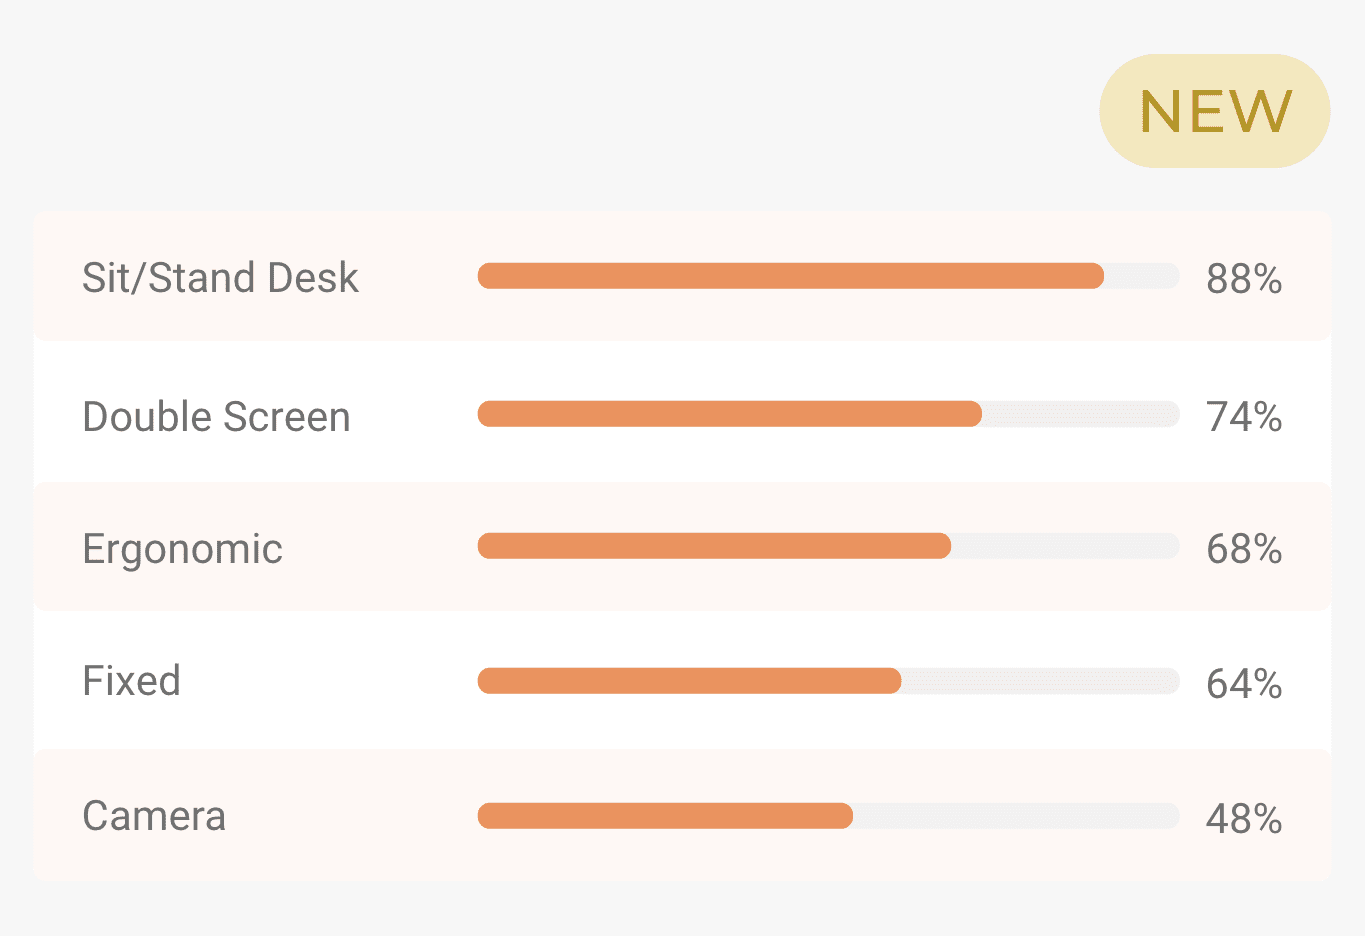
Assets usage
Visualise your most used assets to see what type of desks, meeting rooms and other assets your employees prefer the most.
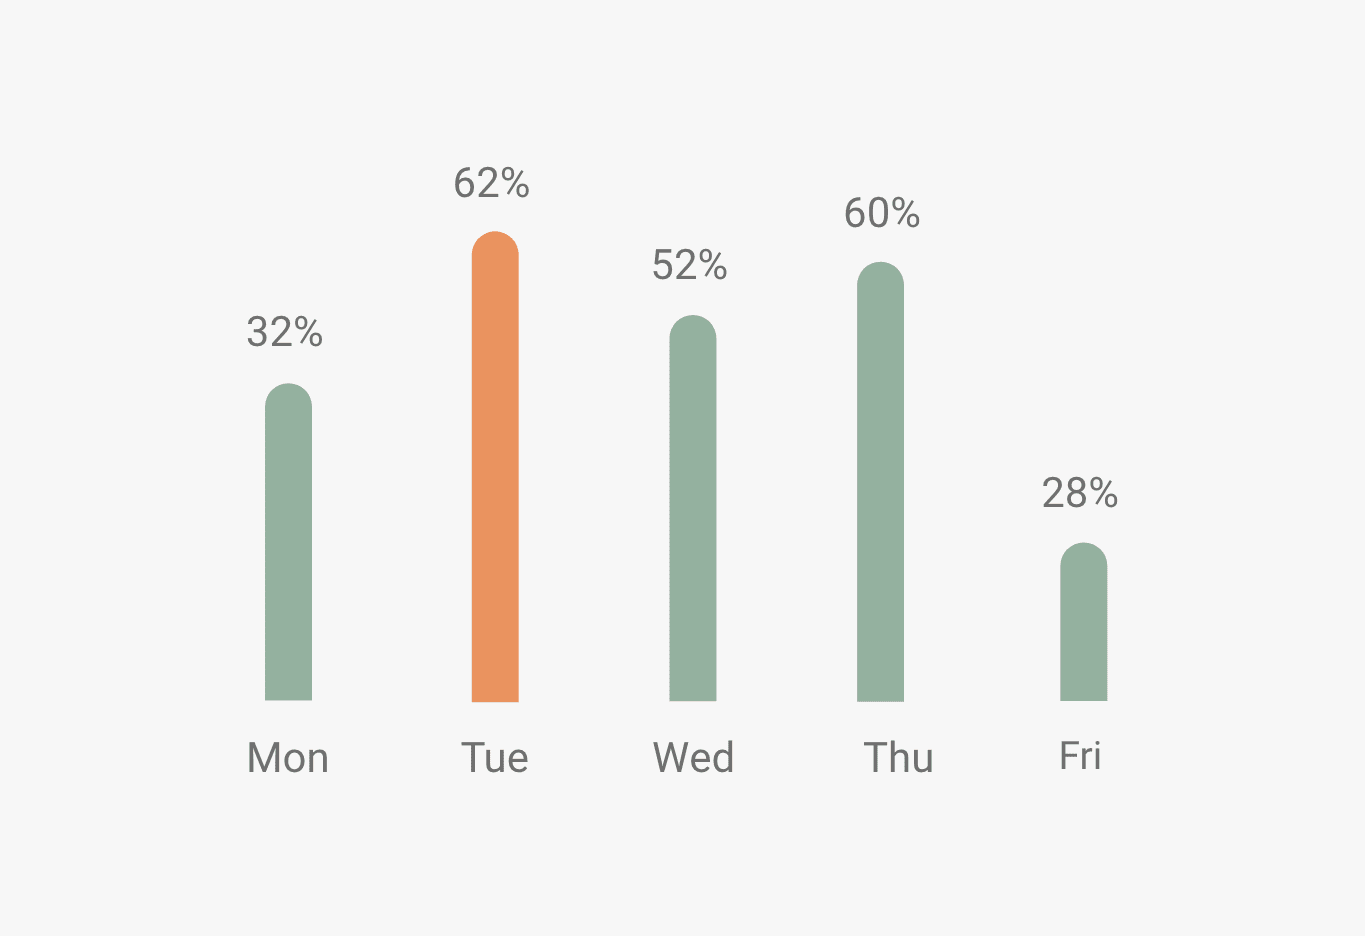
Weekly overview
% of your office usage on most and least popular days of the week, be surprised even on the busiest day how much space goes unused 👀.
Real-time stats
Real-time data overview, to see how your employees are using the space, right now!
Real-time stats
Real-time data overview, to see how your employees are using the space, right now!
Weekly overview
% of your office usage on most and least popular days of the week, be surprised even on the busiest day how much space goes unused 👀.
Assets usage
Visualise your most used assets to see what type of desks, meeting rooms and other assets your employees prefer the most.
"Flexwhere is useful for both users and management in our hospital"
"Flexwhere is an excellent tool for keeping the costs of healthcare housing in check."
 Huib Maclean
Strategic advisor housing

Get Started Now
Ready for a more organised office? Get started for free today – it's the easiest solution to manage your hybrid work week.
-
Intuitive and userfriendly
-
No credit card needed
-
Collaborate with colleagues
-
Customised to your office
-
Comprehensive Support


Desk booking
Book desks and see where your colleagues have booked via the visual floorplan.


Meeting room booking
Quickly see which meeting rooms are available and book directly from the Flexwhere app.


Parking management
If your organisation has a dedicated parking zone, your employees can find and book any one of the available spots.